The platform
One view of every field you serve.
Infrag is the operating picture for the fields your growers enroll: one detailed drone map of each field, the tools to work on it, and its earlier scans behind it. We do the flying and the processing. There is nothing to install.
Flown and processed by Infrag · Nothing to install · First 500 acres free
What it is
From imagery to a decision.
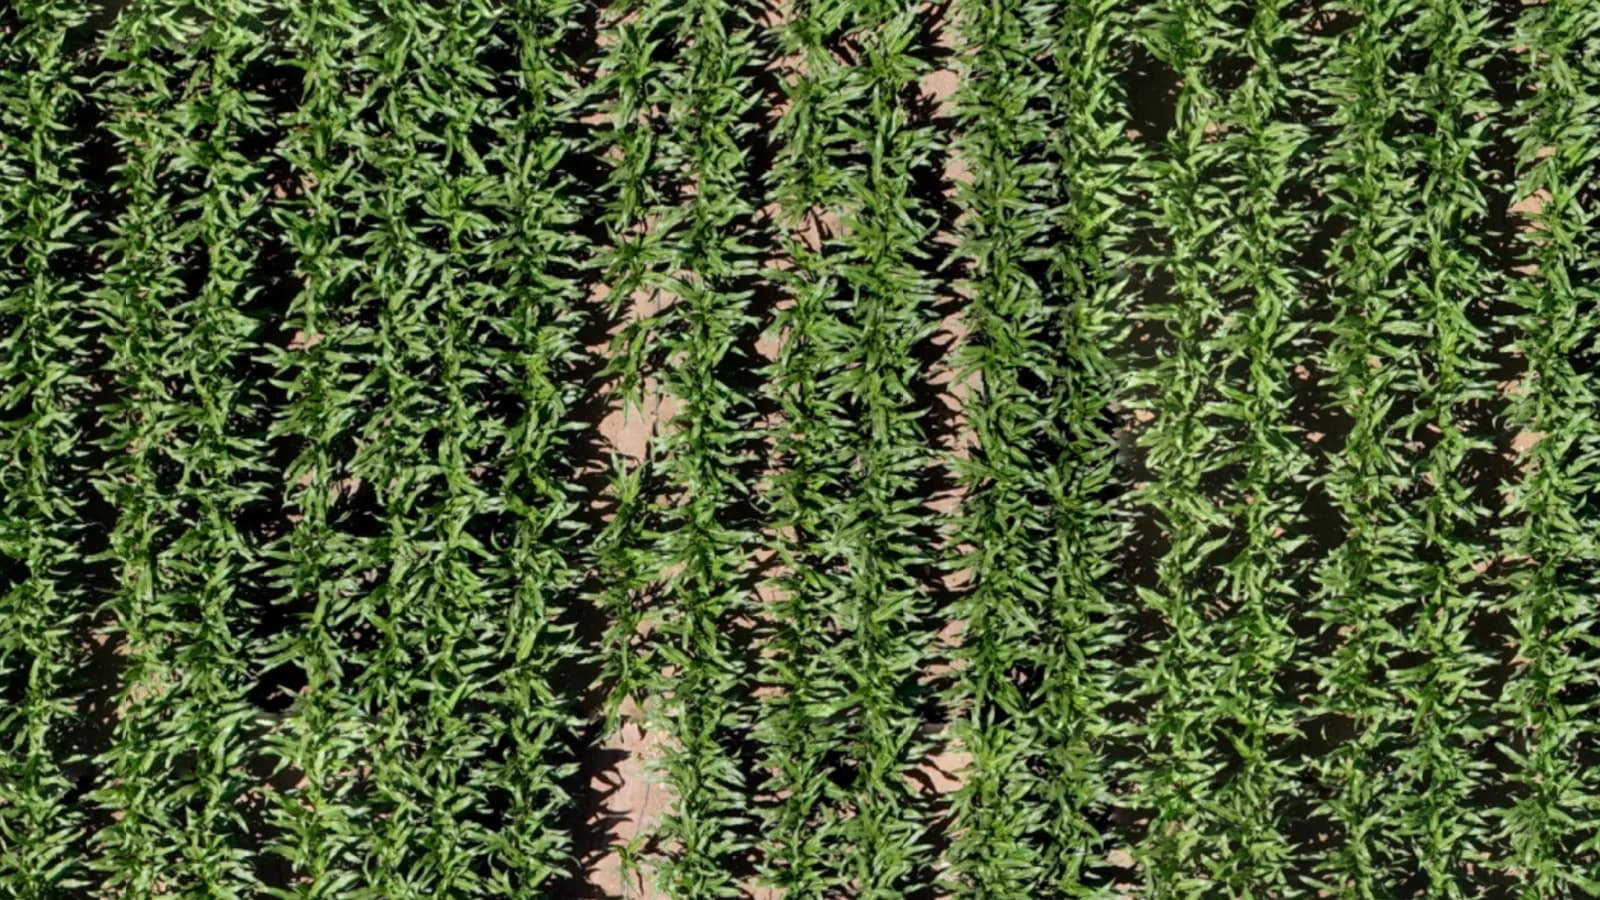
Infrag is not a gallery of drone photos. Each field has one working map, its scans by date and its marked areas, so the next recommendation starts from what the field looks like now.
Every field
A current, detailed map of each field your growers enroll, stitched into one picture.
Every scan
Filed by date. Any two can be set side by side to see what changed.
Every suspected finding
Marked on the map with its location, for a person to check on the ground.
Field map
See the details.
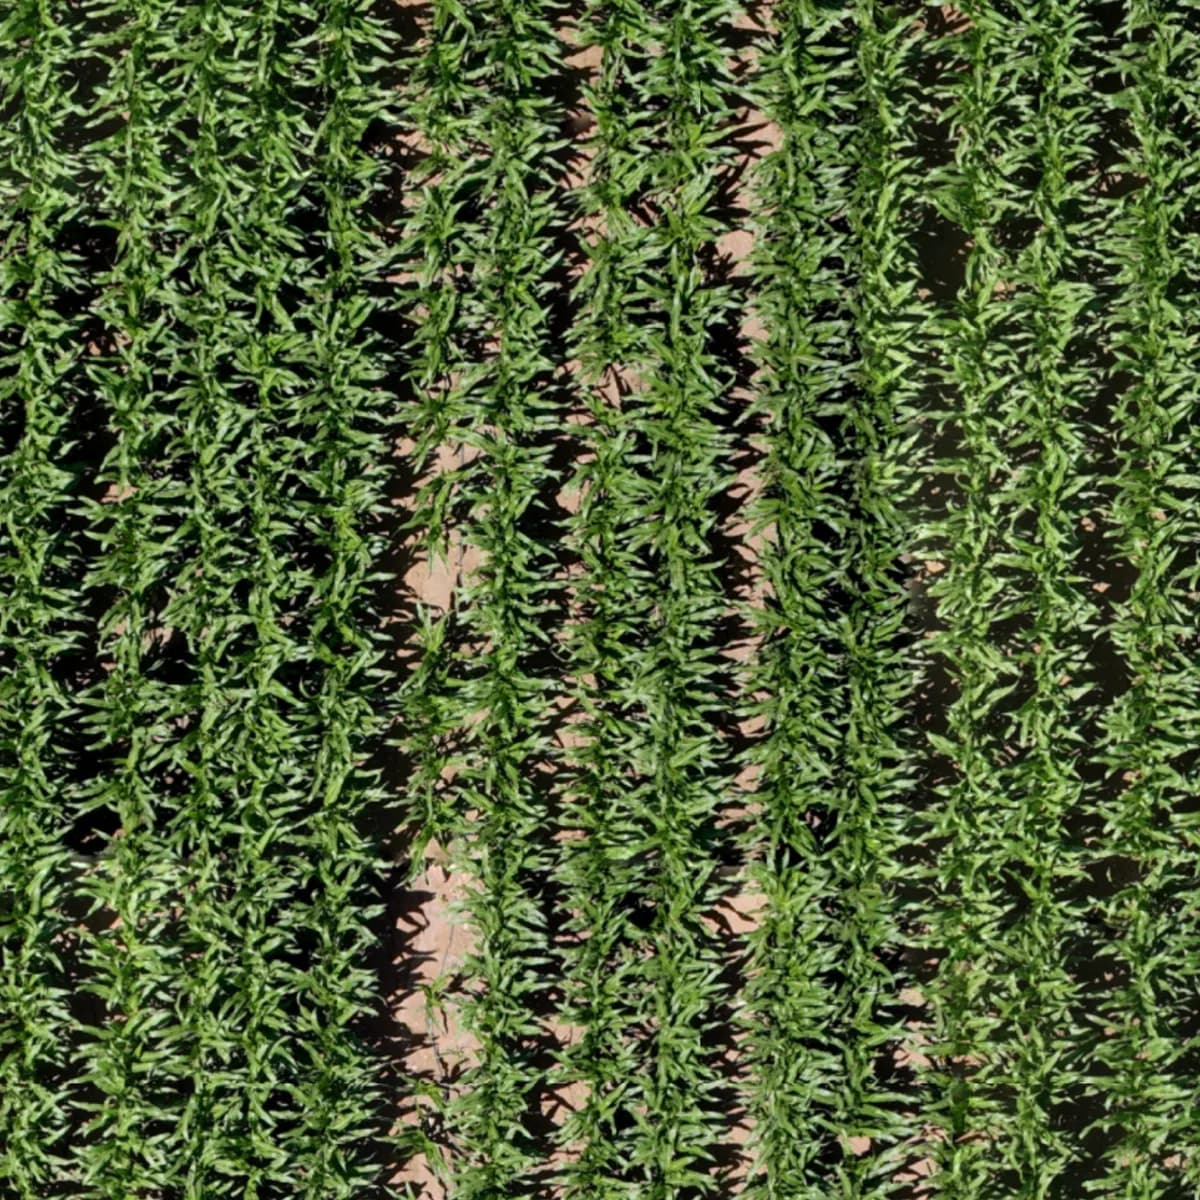
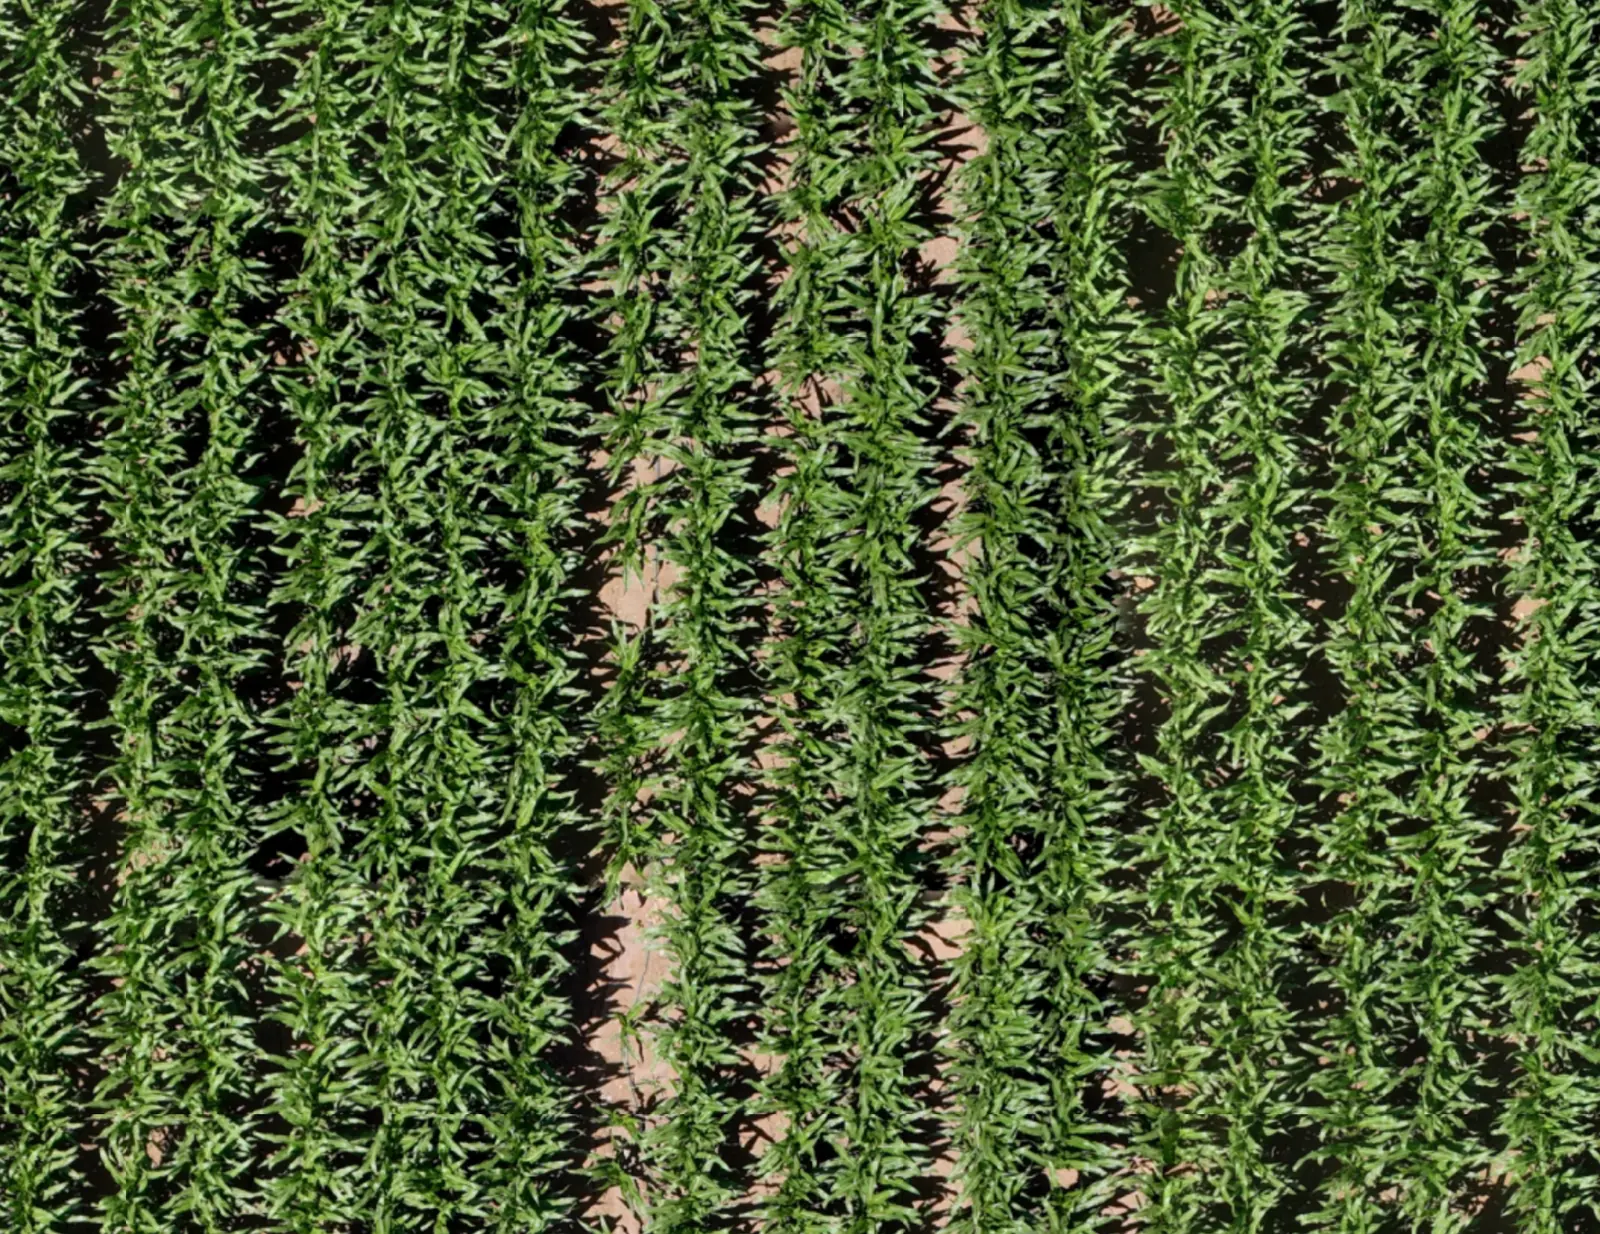
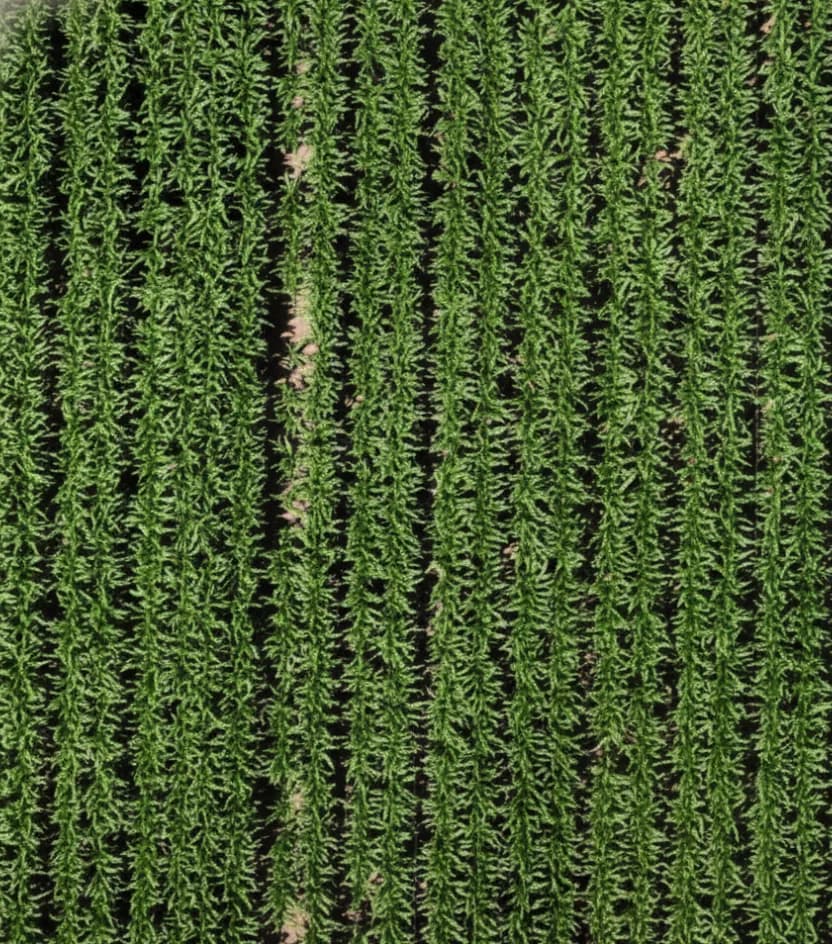
Detailed field imagery lets your team examine individual rows and areas, and decide where to take a closer look.
- The whole field in one stitched map
- Zoom from the field edge down to single rows
- Mark the areas worth checking on the ground
Measure and locate
From image to field location.
Get GPS coordinates for a selected point, draw shapes, and calculate dimensions and areas. Find the exact spot when you return to the field.
- GPS coordinates for any point you select
- Shapes drawn on the map, with their dimensions and area
- The same spot, found again on the next visit
Location
- Lat
- 31.857275
- Lng
- 34.993211
Interface redrawn for illustration.
A 30-minute call with the Infrag team
See it on fields you know.
Compare dates
See what changed.
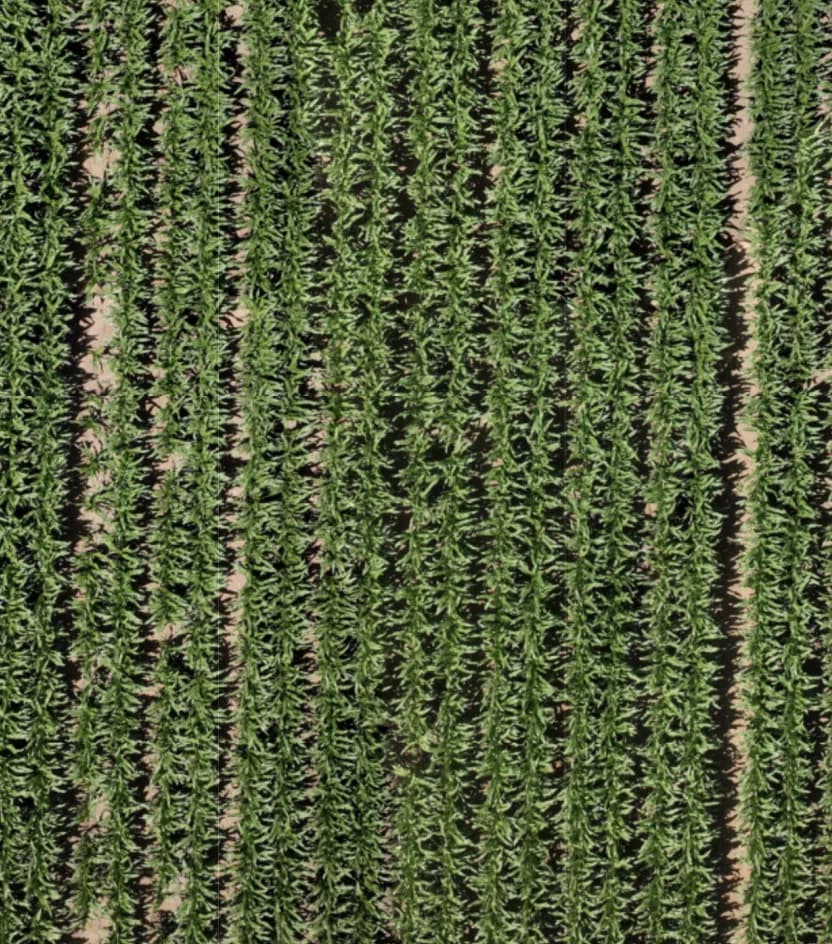
Two dates. The same field. Compare crop appearance between scans, before and after irrigation or fertilization, and through the season.
- Any two scan dates, side by side
- Before and after a treatment
- Something to show the grower, not just tell
Scan archive
Keep each field's history.
Scans are filed by date. Go back to earlier dates in the season to see which areas have changed and which need follow-up.
South 1
Field 23
Interface redrawn for illustration.
Delivered as a service
We fly. We process. You open a map.
You know the land and the growers. We bring the picture.
Nothing to install and nothing to integrate. From row crops to orchards, availability and scheduling are confirmed for each location.
From the map to the day's work
Less guessing. More seeing.
Your team's knowledge of the fields, paired with a view of what is hard to spot from the road.
Focus the next field visit
Look for visible differences in crop growth and mark the areas worth checking on the ground.
Turn a question into a field check
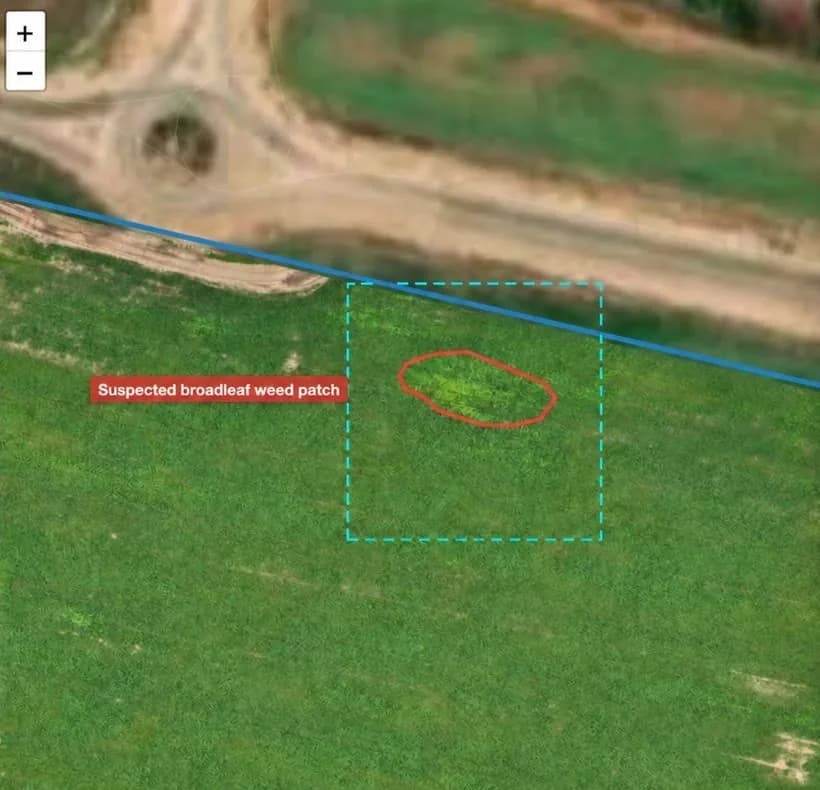
Ask the AI Advisor about a suspicious patch, then have it look for similar areas across the field, so your adviser knows where to inspect next.
South 1
Field 23 · 3 scans
Select an area or ask me what stands out.
This looks like a broadleaf weed patch. I've outlined the suspected area on your map: about 0.07 acres.
Check this spot on the ground to confirm the weeds before deciding on treatment.
See what changed after a treatment
Compare scans before and after irrigation or fertilization, and examine the changes over time.
South 1
Field 23 · comparing 2 scans
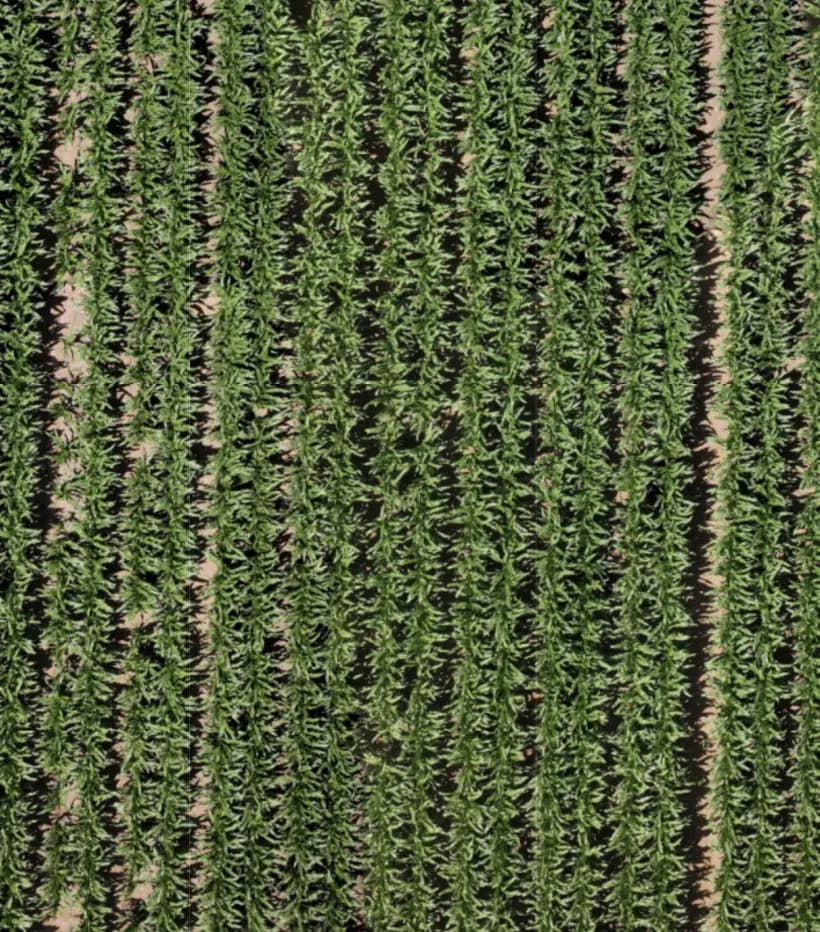
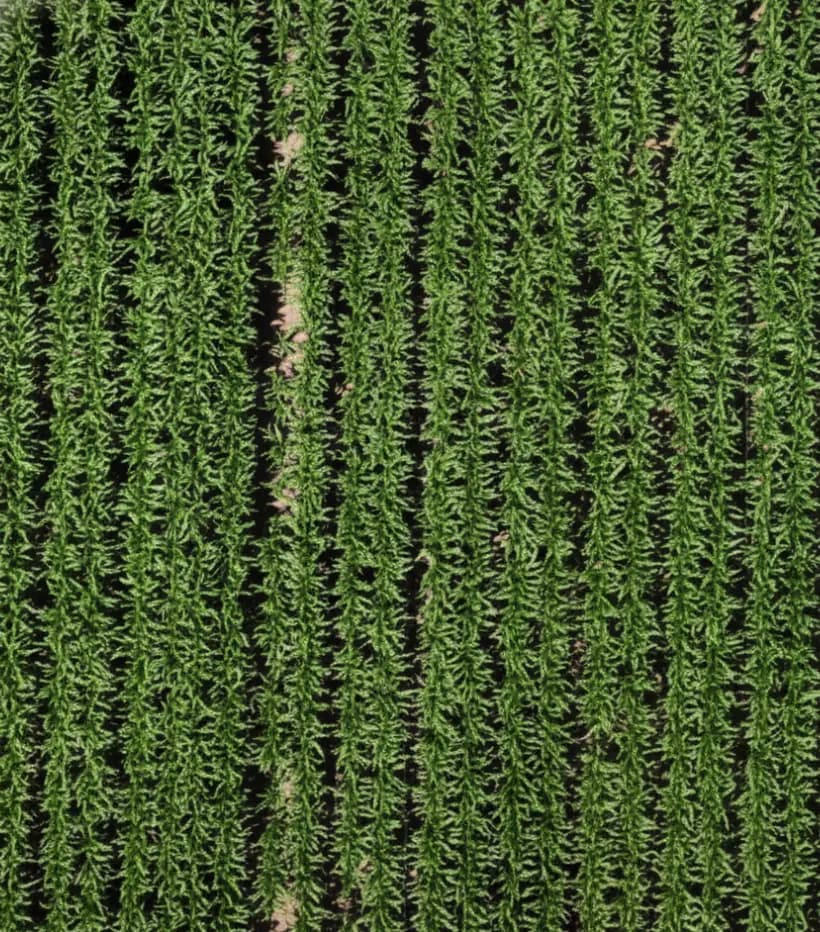
Interface redrawn for illustration. Original field imagery. Scans from 11-13-2025 and 11-27-2025.
Keep the field's history
Go back to earlier dates in the season to see which areas have changed and which need follow-up.
South 1
Field 23
Interface redrawn for illustration.
See it on a field you know.
Your first 500 acres are free. Thirty minutes is enough to plan them.